The Dahua LR camera recorded video sequences of maritime traffic from February 2020 to December 2022. In addition, the video sequences were recorded at different times of the year and day, and under different weather and sea state conditions. Then, images with a HD resolution, i.e. 1920 x 1080, were extracted from the video sequences and man-ually selected for the dataset. The images are saved in .jpg format, have a spatial point density of 96 dpi, a bit depth of 24, and a Standard Red Green Blue (sRGB) color represen-tation. It should be noted that the focus was on images of ships leaving or entering the port of Split, and that the dataset shows mainly the port and starboard sides of the ships.
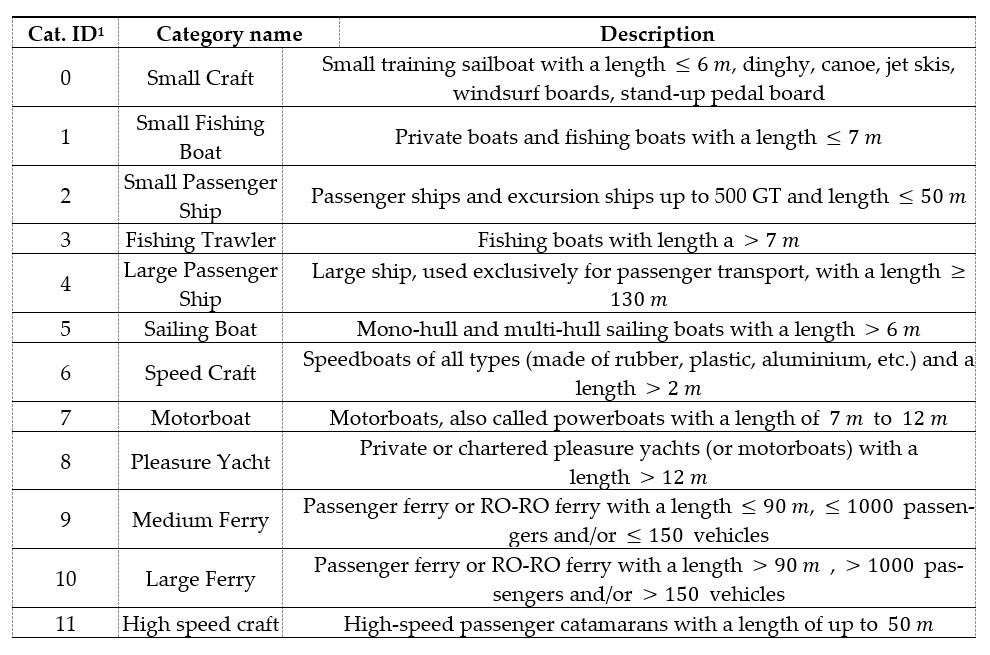
Based on the goals and purpose of the dataset, as well as the nature of the Port of Split, we determined 12 specific ship categories with the help of experts from the Depart-ment of Nautical Engineering. In addition, when defining the ship categories, we had to take into account that the assignment of labels by DCNNs is based on prior knowledge. Therefore, it is preferable to classify ships that "look alike" in the same category when pos-sible. The ship category Identification Number (ID), category names, and descriptions of each category are listed in Table
Images are manually annotated on the desktop computer using Yolo_mark labeler, a Windows and Linux software for annotating Bounding Box (BB) around objects in images for YOLO training and/or validation [24]. The format used for the image annotations is the YOLO-Darknet format [25], but there are many available tools for converting from one format to another. The annotations are normalized in the range [0, 1] with respect to the height and width of the image, which makes it easier to work with the annotations after scaling or stretching the images. As shown in Figure 4, the upper left corner of an image is always a starting point (0,0), the lower left corner is (0,1), the upper right corner is (1,0), and the lower right corner is (1,1).
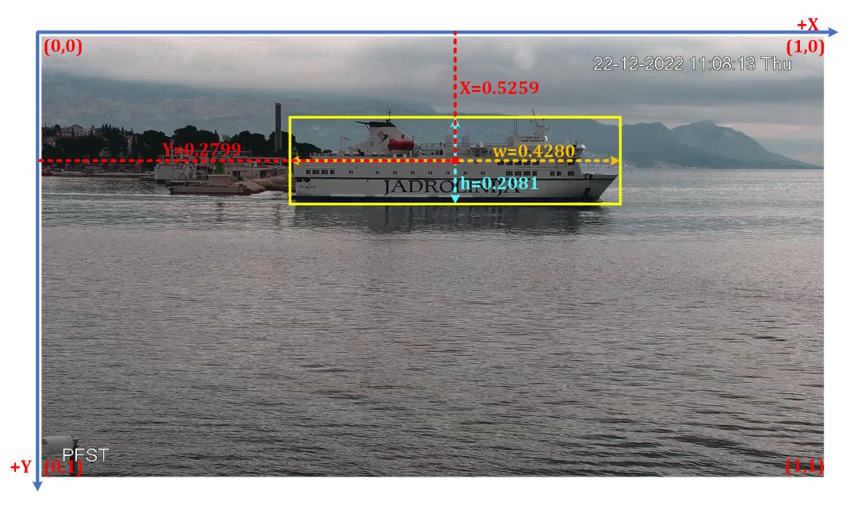
In the same figure, an example image from the proposed dataset is shown, in which the ship categorized as "Large Ferry" (Cat. ID 10 from Table 2) is annotated with the yellow BB, where X and Y are the normalized coordinates of the center of BB, w and h are the normalized width and height of BB. After the image is annotated, a .txt file is created that contains all mentioned BB parameters. For each annotated ship within an image, a new line is created in the same .txt file. An example of the .txt file for the annotated ship from the image shown in Figure 4 is shown in Table 3. Within the proposed dataset, each image contains a .txt file with the same name as the image and is located in the same directory. Images without annotated ships contain an empty .txt file.
If you use this dataset, please citate as follows:
Petkovic, M.; Vujovic, I.; Lusic, Z.; Soda, J. Image Dataset for Neural Network Performance Estimation with Application to Maritime Ports. J. Mar. Sci. Eng. 2023, 11, 578. https://doi.org/10.3390/jmse11030578
Page still under construction ~ ❤